Program/School Coordination
As of December 2000
191 (77%) are a program within a school
32 (13%) are whole-school programs
25 (10%) are unreported

| Section 1: Introductory Statistics |
Section 2: Program Model and Literacy Instruction |
Section 3: NES Ethnicity |
Section 4: Economic Demographics |
Section 5: Demographic Comparison |
Section 6: Staffing |
These are the data corresponding to the ERIC Digest Two-Way Immersion Programs: Features and Statistics, by Elizabeth Howard and Julie Sugarman, Center for Applied Linguistics. More information on Two-Way Immersion may be found here.
The statistics in this Digest were generated from the Directory of Two-Way Immersion Programs in the United States in December 2000, when there were 248 programs listed. There are several pages of regularly updated statistics associated with the Directory's web site:
Below are statistics on school type and third language speakers in two-way immersion programs.
Program/School Coordination | |
|---|---|
| NATIONAL (n=248)
191 (77%) are a program within a school 32 (13%) are whole-school programs 25 (10%) are unreported |
 |
School Type | |
|---|---|
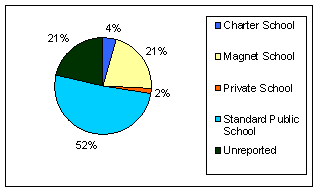
| NATIONAL (n=248)
11 (4%) are charter schools 53 (21%) are magnet schools 4 (2%) are private schools 127 (52%) are standard public schools 53 (21%) are unreported |
 |
| CALIFORNIA (n=86)
8 (9%) are charter schools 22 (26%) are magnet schools 1 (1%) is a private school 51 (59%) are standard public schools 4 (5%) are unreported |
 |
| TEXAS (n=34)
0 are charter schools 6 (18%) are magnet schools 1 (3%) is a private school 25 (73%) are standard public schools 2 (6%) are unreported |
 |
| NEW YORK (n=20)
2 (10%) are charter schools 4 (20%) are magnet schools 1 (5%) is a private school 7 (35%) are standard public schools 6 (30%) are unreported |
 |
NATIONAL (n=248)
In 37 (15%) of the programs, more than 1% of the students are native speakers of a third language (not used in the program)
In 9 (4%) of the programs, more than 5% of the students are native speakers of a third language (not used in the program)
| Section 1: Introductory Statistics |
Section 2: Program Model and Literacy Instruction |
Section 3: NES Ethnicity |
Section 4: Economic Demographics |
Section 5: Demographic Comparison |
Section 6: Staffing |