
Section 6: How in the World do I Analyze the Data?
In this section:
- Introduction to Analyzing Your Data
- What About Statistics?
- Basic Definitions
- How Different Kinds of Scores Can and Can't be Analyzed
- Matching Statistical Analyses to Evaluation Questions
- Example 1 – Question 1: Oral proficiency scores
- Example 2 – Question 2: Academic proficiency categories
- Interpreting Your Data
Now you have figured out your evaluation questions, set up your spreadsheet, and entered all the relevant and interesting data into it. The next step is to make sense of all this data! That's what we mean by interpreting the data. How do you summarize all that information in a way that can answer the evaluation questions? That's where data analysis comes in, and the way you analyze the data depends on the nature of the evaluation question and the nature of the data.
Introduction to Analyzing Your Data
Analyzing assessment data allows you to interpret your student outcomes: Do you understand your population and the effects of your program? Meaningful data interpretation can be guided by questions such as the following:
- Are data disaggregated by important background characteristics such as:
- Language background
- Social class/parent educational background
- Students with special education needs
- How do your results compare with district and/or state averages?
- Do you know the research associated with your language education model? How do your results compare? (Click here for research to which you can compare your results.)
The rest of this discussion will help you understand how to approach data analysis and interpretation in a way that you can answer these kinds of questions. To do so, we need to lay some groundwork in some basic statistical concepts and an understanding of the kinds of assessment scores a program will typically use.
What About Statistics?

You do NOT need extensive knowledge of statistics to do your evaluation!
Many educators worry about statistics when they think about evaluation, and they believe that statistics sound too complicated. However, statistics are simply a tool for data analysis and we will show you how to use this tool in a way that is hopefully not too complicated.
What statistics do you need to know? Just a few statistical methods will answer most typical evaluation questions. These methods fall into the category of descriptive statistics and include:
- Means
- Compare means
- Standard deviations
- Ranges
- Frequency counts
- Crosstabs
Most evaluations typically will not require sophisticated statistical methods such as correlation, chi-square, analysis of variance or regression. Thus, we will not describe these approaches in this basic Toolkit. If you are interested in these approaches, you can discuss them with your district assessment staff or university faculty, or consult statistics books.
Using Statistical Packages
You will need to familiarize yourself with whatever statistical analysis program you have selected. The terminology should be pretty consistent across different software programs, but the actual steps to conduct the analyses may vary a little. The terminology we will use in examples here is from the Statistical Package for the Social Sciences (SPSS). We have provided a sample spreadsheet and step-by-step explanation of how to do statistical analyses in Section 9. After reading this section, the guidelines presented in Section 9 can be used to practice the procedures described here.
SPSS is available for purchase at www.spss.com for either PC or Mac. First, check to see whether your district office has a site license, which would enable you to use it for free.
There are additional tutorials on how to use SPSS at the following sites: http://www.psych.utoronto.ca/courses/c1/spss/toc.htm and http://ssc.utexas.edu/consulting/tutorials/index.html
 Basic Definitions
Mean (same thing as average) refers to the arithmetic average. You can easily compute it by adding all the values and dividing by the number of cases.
Compare means does just that. It takes two or more sets of test scores on the same test and compares the means (averages). The sets of scores can be:
- from two or more different groups of students, to see which had the higher average (e.g., ELL vs. R-FEP students; students on free lunch vs. students not on free lunch),
- from the same group of students tested more than once to see whether students made gains, losses, or stayed the same over a period of time (e.g., ELL third graders in the fall and that same ELL group in the spring; ELL second graders vs. that same group of ELL students in third or fourth grade).
Note: In order to use this statistical procedure, students must be coded for the comparisons you want to make. For example, if you want to make comparisons of ELLs vs. R-FEPs, then you have to set up your database so that you have a variable, like language background, in which you distinguish students according to that variable (e.g., ELL vs. R-FEP vs. EO). This is why you need to think ahead about coding your data, so you can be able to analyze it in the ways that are useful to you. (See examples in Section 4 of the Toolkit.)
Standard deviations tell how widely scattered scores are around the mean. The bigger the standard deviation, the greater the difference among the scores. For example, if you tested a group of students on a reading test and then averaged (or computed the mean of) seven students' scores—35, 40, 45, 50, 55, 60 and 65—the mean would be 50. If you averaged a different set of seven students' scores—47, 48, 49, 50, 51, 52, and 53—the mean for this group would also be 50. But there's obviously a lot of difference (or deviation) between the scores in the first set—much more so than in the second set (i.e., in the first set, there are much lower and higher scores than in the second set, which are grouped closer together) and that difference is captured in the standard deviation.
Range refers to the highest and lowest scores in a set of scores. In the example above, the first data set had a range of 35 to 65. The second set of scores had a much smaller range, 47 to 53. Remember that both sets of scores had the same average, 50. The range shows how much territory the scores covered.
Frequency counts are merely the number of scores or people in a category. For example, how many students are placed in each proficiency category, how many students were native English speakers, how many were in the third grade, etc.
Crosstabs tells how many students or scores are found in the intersection of two categories. For example, how many third graders were native Spanish speakers, how many students who scored at the intermediate proficiency level in 2005 also scored as intermediate in 2006, etc. [Note. The database would have separate columns for each variable you were interested in crossing or intersecting—in this example, that would be language groups, grade levels, 2005 proficiency levels, and 2006 proficiency levels. See Section 4 for an idea of how to do this coding].
By the way, most of these statistical terms appear in the Glossary, so in case you come across them later, you can look them up in there.
How Different Kinds of Scores Can and Can't Be Analyzed
Descriptive statistics—means, standard deviations, ranges, compare means—are appropriate for NCE scores, standard scores and scale scores (described in Section 5). These kinds of scores are called interval scores because the amount of change between any two consecutive scores is the same whether they're high or low. They are like a thermometer in that regard. A one degree change from 41 to 42 is the same amount of change as from 65 to 66.
Some descriptive statistics—means, standard deviations, compare means—are not appropriate for percentiles, grade equivalents, or any kind of categorical scores, including stanines and performance levels (described in Section 5). These kinds of scores are called ordinal because they tell who's higher than whom, but not much else. The amount of change for a student moving from level 2 to level 3 isn't necessarily the amount of change for a student moving from level 3 to level 4.
Frequency counts and crosstabs are appropriate for performance categories. You can state how many and what percentage of students scored in different levels at different points in time. Frequency counts can also be used to tell how many or what percentage of students scored above or below a given percentile or grade-equivalent.
Do not attempt to average percentiles and grade-equivalents. If you want to obtain an average percentile, first average the NCE scores, then consult the NCE/Percentile conversion table (described in Section 5) for the corresponding percentile rank.
Do not attempt to average performance categories or levels. A student is in level 1 or level 2 or level 3, etc. It doesn't make any sense to say, on average, students scored at level 2.3. Just count the number and percentage of students who scored at each level. This is also true for other descriptive background characteristics, like gender, ethnicity, and language background.
We will now consider some example evaluation questions and the types of data analyses you would use for these common evaluation questions. Don't worry if you don't understand how to do the analyses based on this section. In Section 9, we will present step-by-step directions for how to run these analyses in a statistical software program (SPSS). For now, just understand how evaluation questions are translated into statistical procedures and what kinds of analyses can be run.
Matching Statistical Analyses to Evaluation Questions

Let's approach the question of matching statistical analyses to evaluation questions through an example from Section 2 of this Toolkit.
EXAMPLE 1
Question 1: What kind of progress have students in the different groups made in their oral and written proficiency in each language?
This question requires the following kinds of data to be kept in the database.
- First, the word "progress" implies changes over time, probably annually. Therefore, the database has to have scores from each year of the students' participation, clearly labeled by which year it is. Interval-level data (e.g., NCE scores, scale scores, and total scores on instruments such as SOLOM or FLOSEM) work well for longitudinal analysis.
- "Different groups" implies that the groups of interest are known, probably English speakers and Spanish speakers, or different proficiency levels (ELL, R-FEP, EO), or maybe students of different ethnicities or SES status—whatever your question of interest is. The groups of interest have to be coded in the database in order to conduct analyses on them (See Section 4, Setting Up the Database.)
- "Oral and written proficiency in each language" implies at least four scores per year—a score in oral English, a score in oral Spanish, a score in written English, and a score in written Spanish. Scores on the same test must be recorded for each year. (If it's a different kind of test each year, the scores won't be comparable, and the analysis will not make sense—for example, using the LAS or FLOSEM one year and the SOLOM the next year—see Section 3 for a description of oral proficiency tests). For oral proficiency, some sites might use two tests—one required by the state and one selected by the school site. In that case, you will want to be sure you use both each year.
Let's use oral proficiency in English and Spanish as an example. (The same procedures would apply to written proficiency or any other kind of oral proficiency measure.) Let's assume your project uses the SOLOM (described in Section 3), which yields scores on a scale of 5-25. Technically, SOLOM scores are really ordinal-level scores, but with the range of 21 points, they can reasonably be analyzed like interval-level scores. Some people refer to the scores of 5-25 as “raw” scores. They aren’t really, but they can be considered that way because everyone understands the range and what the scores mean.
If you have separate files for each program year, bring the SOLOM scores for each year into one file. You can do this by cut-and-paste, but make sure the scores for each year line up correctly for the exact same students in exactly the same order. This is where recording the student ID numbers becomes very helpful. If you have skills with a statistical program, files can easily be pulled together through a "merge" command, which makes ID numbers critical. Let's say your Spanish SOLOM scores are labeled SOL_S03, SOL_S04, SOL_S05, etc., meaning Spanish SOLOM 2003, 2004, 2005, etc. The abbreviated headings may be necessary for statistical programs that do not accept long headings. Now if you have a single column for the language groups (L1 in chart below), coded S for native Spanish speaker and E for native English speaker (better yet, 1 for one of them and 2 for the other), you can calculate the annual averages very quickly.
If you are interested in the long-range outcomes for students who have been served in the program the longest, for example, the current fifth-graders, you should select Grade 5 for the analysis and exclude the other grade levels. You can do this a couple of ways. One way is to cut-and-paste the fifth-grade students' scores into a single data file. Another is to use the "select cases" feature in your statistical program. Select "compare means" for your analysis. Then select each year's Spanish SOLOM scores as the dependent variable. Then select the coded language groups as the independent variable. Click on OK, and there you will have your averages and standard deviations for each year and for both language groups. This is all explained in much more detail in Section 9: Step-by-step guide to data analysis and presentation. The statistical output from this compare means analysis might look like this:
Table 1
Average SOLOM Scores for Students Across Academic Years 2001 to 2006 By Language Background
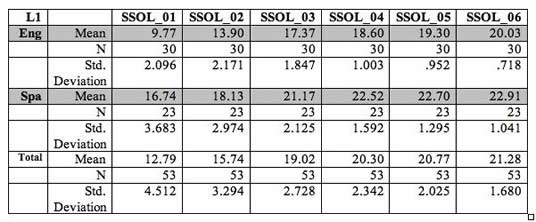
Selecting the compare means analysis gave separate information for the fifth-grade English speakers (E) and Spanish speakers (S) regarding their Spanish proficiency development across years 2001 to 2006. You will see that for each year, the output shows the mean (average) for each group, the number of students whose scores were used (N) and the standard deviation of the scores. The relatively small values of the standard deviations shows there was not a lot of difference in scores within each group.
The output also provides the "Total," the annual average for the combined groups of English and Spanish speakers. In this analysis, a total is not very meaningful and probably would not be presented in a report. However, note that the standard deviation is larger for the total group than for the separate groups. That's expected because the Spanish speakers had generally higher scores on the Spanish SOLOM, and the English speakers typically had lower scores, so when you combine the two groups, there is a greater spread of scores.
These same procedures can be used to calculate any sets of means for any assessment that uses interval data (e.g., NCE scores and scale scores). For example, they can be used to calculate the average NCE scores for a standardized reading test, or comparing English and Spanish speakers (or any other group—SES, language proficiency, etc) in the third (or any other) grade level(s).
EXAMPLE 2
What if you are using scores that are performance categories or levels? Those cannot be averaged. The best way to analyze those scores is by frequency counts, that is, how many students in each language group placed at each level each year. Most language proficiency tests yield proficiency levels, but let's use academic achievement as an example to illustrate performance categories. Under NCLB accountability, schools are required to report percentages of students who meet the standard of academic proficiency in such subjects as reading, language arts and mathematics. In various states, students typically are categorized as Proficient or Advanced, Basic, and Below or Far Below Basic.
Let's examine the evaluation questions:
Question 1a: Do English learners in our program show improvement in their performance in English language arts?
Question 1b: How do English learners in our program compare with English learners in other programs in our district in English language arts?

Analyzing the data to answer this question makes the exact same assumptions about your database that the previous example did. The only difference is that this time, you have separate columns of scores in English language arts for two consecutive years, and those scores are in the form of performance categories or levels. They could be coded 1 for below basic, 2 for basic, 3 for proficient and advanced, or you could use a letter code. (There's an advantage to the numeric code we'll mention later. For more information on coding and data entry, see Section 4.)
The easiest way to derive the answer to the question is through the crosstabs analysis, which is considered a descriptive statistic. Let's say you want to compare your third-grade ELL students in 2004 with the rest of the district's ELL students that year. Select the 3rd grade students for that year. Locate the Descriptives function in your statistics program. Then select Crosstabs. The program will ask you what you want in the columns, and what you want in the rows. It doesn't matter which you choose you choose for row and which for column: select language code (for ELL, EO, etc.) for one, let's say columns, then the language arts performance categories for the other, let's say rows. Click OK, and voila! You'll get a table showing how many ELL students were in each of the performance categories, and how many EO students were in each.
Wait a minute. Our evaluation question didn't ask about comparing ELL and EO. However, given the set-up of the database, this was the easiest way to get the information you wanted. You can just cut and paste, or re-enter, the ELL information into a table in your word processing program and ignore the EO information. (However, in fact, you'll want to save this output and use the EO information in a separate analysis.)
Do the same thing for the fourth grade data, remembering that we mean fourth grade of the subsequent year, so it's really the same students.
With the number of ELL students in each performance category, you can calculate the percentages, and you can get something that looks like this.
Percentage of ELL Third and Fourth Graders in
Each Performance Category in Reading/Language Arts
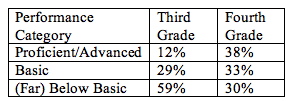
This analysis answers the second part of the evaluation question. ELL students in the program do show improvement in English language arts as measured by the state test because, from third to fourth grade, the percentages in the proficient/advanced category increased dramatically, and the percentages in the below basic category decreased dramatically. (To see this table in chart form, see Figure 2 in Section 7.)

For the second part of the question, how do English learners in our program compare with English learners in other programs in our district in English language arts, the exact same information in the above table can be used. It just needs to be placed side by side with the district data. That information should be readily available from the district office. (In California, you can consult the California Department of Education to gather school-wide, district-wide, and state-wide data for various subgroups of students) If you focus on the more recent data, that is, the fourth grade data, you might produce a table that looks something like this:
Table 3
Comparison of Percentage of ELL Fourth Graders in TWI vs. District in
Each Performance Category in Reading/Language Arts
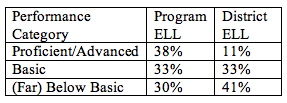
The analysis answers the evaluation question by showing a much higher percentage of program ELL students in proficient/advanced than district ELL students, and a much lower percentage in below or far below basic. (To see this table in chart form, see Figure 3 in Section 7.)
 Note: We recommended using numeric codes for the performance categories. Here is a good, practical reason why. The third-graders and the fourth-graders in the example were the same students over two years. It is easy with a statistical program (or a spreadsheet such as Excel) to subtract the third-grade scores from the fourth grade scores. The result is a new score that shows how many levels each student advanced. That would allow you to make a statement, "The increased percentages in the top category reflect that X-number of students advanced from Basic to Proficient/Advanced." Even more simply, you can do a cross-tabs analysis that would show change in categories from one year to the next (you would select on third grade ELL students, then use 2005 performance categories for your row and 2006 performance categories for your column—or vice versa). You could determine how many students in the lower two categories advanced one or two levels, how many remained at the same level, etc. We show you how to do this in Section 9.
Interpreting Your Data
![]() Some evaluation questions compare dual language students to district or state averages. Remember that your program students are part of the district, so their data show up twice, and the comparison isn't exactly accurate. This may not be important for a small program in a large district, but the larger the program population is in relation to the whole population, the bigger the problem it is.
Some evaluation questions compare dual language students to district or state averages. Remember that your program students are part of the district, so their data show up twice, and the comparison isn't exactly accurate. This may not be important for a small program in a large district, but the larger the program population is in relation to the whole population, the bigger the problem it is.
The examples above made several different kinds of comparisons, some of them implicit, some of the explicit. They provided data that compared:
- Spanish-speaking students with themselves over time in oral Spanish proficiency,
- Spanish-speaking students with a standard of "proficient" as defined by the SOLOM,
- English-speaking students with themselves over time in oral Spanish proficiency,
- program ELL students with the state language arts standard at two consecutive grade levels, showing what percentages were in each performance category,
- program ELL students with themselves as third and fourth graders on the state language arts test, or
- program ELL students with district ELL students in their performance on the state language arts test.
Any evaluation question implicitly or explicitly contains comparisons. Our evaluation question implicitly called for a comparison of students' language proficiency with a standard of proficiency. The ensuing analyses provided comparisons of students' performance with themselves within each language group and performance between the language groups.
Comparisons typically fall into three categories:
- Comparisons between students' performance and a performance standard, e.g., number or percentage of students who become proficient, number or percentage of students who meet grade-level expectations in academic content areas, number or percentage of parents who express satisfaction with a program's benefits for their children.
- Comparisons of students with themselves over time, e.g., increasing average SOLOM scores from year to year, increasing numbers or percentages of students who demonstrated academic proficiency from year to year, number or percentage of students who were proficient in a given language at the beginning and the end of a program.
- Comparisons of students in different groups, e.g., comparison of ELL students in the program with ELL students statewide or in the local district in academic proficiency, comparison of language proficiency progress between students who began the program with different degrees of native language proficiency, comparison of students' language proficiency outcomes in different program models.
In the second part of this section, we gave examples of outcome evaluation questions in addition to the one illustrated above. Let's look at some of them and identify the implicit or explicit relevant comparisons.
- What are the academic achievement outcomes for students from the different language groups at different points in time?
This question contains three implicit comparisons: annual comparison with an academic achievement standard, students' comparisons with themselves from year to year, and comparisons between students in the two language groups annually.
- Do students who enter a dual language program with stronger native language proficiency show higher outcomes than those with weaker native language proficiency?
This question contains implicit comparisons with a standard of native proficiency, without which it's impossible to say who is stronger and who is weaker. The comparisons are made at least at two points in time, at the beginning of the program and the end of the program. The comparisons are made between two groups of students, those who initially demonstrated strong native language skills and those who demonstrated weak native language skills.
- What attitudes do students and their parents demonstrate toward their participation in the program?
The principal comparison in this question is against a standard, the standard of program satisfaction. Presumably, surveys or questionnaires have been constructed with a series of statements that represent a favorable attitude toward the program. Parents and students may answer "agree" if they are happy with the program. That's the standard. Then students' and parents' responses can be compared. Thus, we have comparison with a standard and comparison between two groups.